
Two new resources that might be useful :
Matt Artz at ESRI operates a new site containing news, resources, commentary, and interviews on the use of GIS for science, on: http://gisandscience.com
A new resource called GIS Pathway is on: http://gispathway.com
Its goal is to “help guide you to success in the world of GIS.”
The whole site is operated by a community college student!
GIS Lessons Library
New GIS-based lessons have been added to the ArcLessons library (http://www.esri.com/arclessons).
1) On the Road Again: Transportation Analysis in the USA
http://gis.esri.com/industries/education/arclessons/search_results.cfm?id=392
This 70-question lesson and spatial data are to be used with ArcGIS software
by ESRI to study the spatial pattern of transportation--roads, waterways,
railroads, and airports, in the USA. What is the longest interstate highway?
The longest US highway? How are the highways numbered? What impact do
metropolitan areas have on traffic volume? What are the busiest roads
in your community? The data source is the wonderful National Transportation
Atlas Database:
http://www.bts.gov/publications/national_transportation_atlas_database/2008/
2) US Presidential Election: 2008 - Revised Edition
http://gis.esri.com/industries/education/arclessons/search_results.cfm?id=391
U.S. Presidential elections are always good times to explore the geography
of the United States. These data sets and project files for two GIS software
packages - ArcView - (www.esri.com/arcview) and ArcExplorer Java Edition
for Education (www.esri.com/aejee)- will give you a start in the exploration.
There are many ways in which to use this data. How would you use this
data as a presidential candidate (What issues will be important in which
geographic regions?), a campaign strategist (Where do you spend your time
and advertising budgets?), or a news analyst trying to identify good story
angles (Which states have been "safe" for one party or another,
and which have been "battleground" states?).
3) Baseball Radio Station Analysis
http://gis.esri.com/industries/education/arclessons/search_results.cfm?id=390
This 54-question lesson and spatial data are to be used with ArcGIS software
by ESRI to study the spatial pattern of radio stations that broadcast
major league games of the Kansas City Royals and St Louis Cardinals. What
pattern do they show? What is the pattern of cities that have major league
baseball teams? This lesson may be especially timely to run now (even
though, sadly, the Milwaukee Brewers have lost) during the baseball playoffs
and World Series!
4) DEM: Downloading and Analyzing
http://gis.esri.com/industries/education/arclessons/search_results.cfm?id=367
This 20-page step-by-step lesson walks a user through downloading a Digital
Elevation Model from the USGS seamless data server, formatting it, projecting
it, and using it within a 2-D ArcMap session and a 3-D session using 3-D
Analyst. In addition, National Land Cover Data (NLCD), Digital Orthophotoquads
(DOQ), and Digital Raster Graphic (DRG) data are also downloaded and used.
Derivative products are created from the data, including contour lines,
slope, aspect, hillshade, and TIN. Software: ArcGIS 9.2 with Spatial Analyst
and 3D Analyst. Author: Joseph Kerski, ESRI.
5) Analyzing Historic and Current Population in Utah
http://gis.esri.com/industries/education/arclessons/search_results.cfm?id=370
In this Geographic Information Systems (GIS)-based lesson, students have
the opportunity to investigate the spatial and temporal patterns of population
change over the past 100 years in Utah, consider the reasons for those
changes, investigate detailed demographic characteristics at the county
and city level, and use GIS to decide where to locate their new home in
Utah. My favorite part of the lesson is the graphs comparing decade-by-decade
population change, coupled with the maps. One could take these procedures
and guiding questions and apply them to any state, or to country-level
analysis. Software: ArcGIS 9.2. Author: Joseph Kerski, ESRI.
6) Japanese American Internment
http://gis.esri.com/industries/education/arclessons/search_results.cfm?id=366
Japanese Americans living in the "military zone" along the Pacific
coast of the United States, were sent to internment centers throughout
the western part of the country following the bombing of Pearl Harbor
and the start of war in the Pacific in 1941. Internment followed on over
a half century of discriminatory immigration and land ownership laws against
Asians in general and Japanese immigrants specifically. It represents
the degree to which racial and cultural intolerance can be carried when
mixed with the fear and hysteria of war. And it was not formally recognized
in the national conscience with an apology and reparations until nearly
a half century after the war's conclusion. The history of the event represented
in the documents included in the Japanese American Internment site is
at once a story of immigration, significant constitutional issues, racial
discrimination, and the lengthy amalgamation of cultures.
The GIS activities included here are part of this larger collection of
internment materials. In addition to the GIS activities the unit also
includes more traditional primary and secondary resources including: letters,
court records, government documents, newspaper articles & editorials,
propaganda posters, political cartoons, art work, and photographs. The
entire unit can be accessed on the web at: http://www.intimeandplace.org/Japanese_Internment/
Sample lesson materials are included, but teachers are encouraged to adapt
the resources in the collection to best meet theirs and their students’
needs. Software: MyWorld. Author: Rick Thomas, In Time and Place.
7) Yosemite: First Visits, Lasting Impressions
http://gis.esri.com/industries/education/arclessons/search_results.cfm?id=369
Parks for the preservation of landscape, wildlife, and history are found
around the world today in places as different as Costa Rica, New Zealand,
and Kenya. They owe their existence in large part to the example created
by the United States beginning with Yosemite in 1864. Yosemite is special
in several important ways. Geologically, the park is a series of glacially
carved, white granite canyons, many over a thousand feet deep. The most
spectacular of these is Yosemite Valley itself. Archeologically, humans
have populated Yosemite on and off going back almost to the end of the
last ice age over 10,000 years ago. Villages of Miwok and Paiute natives
existed in Yosemite until shortly after first contact with European settlers
in the 1850's. Their legends provide an important and interesting perspective
on many of the park's most spectacular features. And, historically, Yosemite
has provided an important laboratory for the evolution of the national
park idea. Writers like John Muir and Frederick Law Olmstead, artists
like Albert Bierstadt, Thomas Hill, and Chris Jorgenson, and photographers
like Carlton Watkins helped acquaint potential visitors and legislators
with Yosemite's wonders in the late 1800s. Early Yosemite business people
like Thomas Hutchings and David and Jeannie Curry helped shape how Yosemite
was made accessible to visitors. And far sighted national leaders like
Teddy Roosevelt brought a broad vision of preserving special pieces of
the American environment.
Materials for download here include the GIS based activity that is part
of a larger collection of Yosemite teaching resources found at: http://www.intimeandplace.org/Yosemite/
The complete collection also includes written, photo, and static map items
and related activities. The goal of the unit is for students to gain an
understanding of the early history of the "national park" idea
by examining the emergence of Yosemite as a park. The GIS activities allow
a geographic exploration of the park by inviting students to travel the
trails of Yosemite with early explorers, visitors, and the U.S. Calvary.
Sample lesson materials are included here, but teachers are encouraged
to adapt the resources in the collection to best meet theirs and their
students’ needs. Software: MyWorld. Author: Rick Thomas, In Time
and Place.
We invite you to contribute to the ArcLessons library!
Joseph J. Kerski, Ph.D
Education Manager
Environmental Systems Research Institute, Inc.- ESRI
1 International Cour
Broomfield CO 80021-3200 USA
E: jkerski@esri.com
Landsat Data Available at No Charge
Imagery for Everyone…
Timeline Set to Release Entire USGS Landsat Archive at No Charge
RESTON, VA – The USGS Landsat archive is an unequaled 35-year record of the Earth’s surface that is valuable for a broad range of uses, ranging from climate change science to forest management to emergency response, plus countless other user applications. Under a transition toward a National Land Imaging Program sponsored by the Secretary of the Interior, the USGS is pursuing an aggressive schedule to provide users with electronic access to any Landsat scene held in the USGS-managed national archive of global scenes dating back to Landsat 1, launched in 1972. By February 2009, any archive scene selected by a user – with no restriction on cloud cover – will be processed automatically to a standard product recipe, using such parameters as the Universe Transverse Mercator projection, and staged for electronic retrieval. In addition, newly acquired scenes meeting a cloud cover threshold of 20% or below will be processed to the standard recipe and placed on line for at least six months, after which they will remain available for selection from the archive.
Newly acquired, minimally cloudy Landsat 7 Enhanced Thematic Mapper Plus (ETM+) data covering North America and Africa are already being distributed by the USGS over the Internet at no charge, with expansion to full global coverage of incoming Landsat 7 data to be completed by July 2008 (see timeline below). The full archive of historical Landsat 7 ETM+ data acquired by the USGS since launch in 1999 will become available for selection and downloading by the end of September 2008. At that time, all Landsat 7 data purchasing options from the USGS, wherein users pay for on-demand processing to various parameters will be discontinued.
By the end of December of 2008, both incoming Landsat 5 Thematic Mapper (TM) data and all Landsat 5 TM data acquired by the USGS since launch (1984) will become available, with all Landsat 4 TM (1982-1985) and Landsat 1-5 Multi-Spectral Scanner (MSS) (1972-1994) data becoming available by the end of January 2009. All Landsat data purchasing options from the USGS will be discontinued by February 2009, once the entire Landsat archive can be accessed at no charge.
Landsat scenes can be previewed and downloaded using the USGS Global
Visualization Viewer at http://glovis.usgs.gov [under “Select Collection”
choose Landsat archive: L7 SLC-off (2003-present)]. Scenes can also be
selected using the USGS Earth Explorer tool at http://earthexplorer.usgs.gov
[under “Select Your Dataset” choose Landsat Archive: L7 SLC-off
(2003-present)]. For further information on Landsat satellites and products,
see http://landsat.usgs.gov
~End of official message~
Just as an FYI - to clarify some points in the announcement. This plan
will only allow 1 recipe of data to be produced. L7 data will not have
any gap correction applied. The 20% or less cloud cover images will be
processed automatically, the higher cloud cover scenes will be processed
as ordered with no plans for prioritization of orders.
Pixel size: 15m/30m/30m
Media type: Download (web-enabled)
Product type: L1T (terrain-corrected)
Output format: GeoTIFF
Map projection: UTM
Orientation: North up
Resampling: Cubic convolution
DEM: GLS DEM (SRTM, NED, CDAD, DTED, GTOPO 30)
If you have any questions or comments, please contact any or all of the
following:
Kristi Kline, PMP
Landsat Project Manager
kkline@usgs.gov
James Lacasse, PMP
Landsat Mission Management Officer
jmlacasse@usgs.gov
Rachel Headley, PhD
Scientist, Landsat Project
Data Acquisition Manager, Acting
rheadley@usgs.gov
Brenda K. Jones
Disaster Response Coordinator
USGS EROS Center
Email: bkjones@usgs.gov
Urban and Environmental Modelers Datakit Available
Looking for GIS data for the U.S.?
It is with great pleasure that we announce the release of the Berkeley/Penn
Urban and Environmental Modeler’s Datakit. This new website (www.dcrp.ced.berkeley.edu/research/footprint)
contains more than 150 downloadable ArcMap-ready shapefiles and raster
datasets for the 48 contiguous United States. The data is free to all
users and includes:
• 1990 and 2000 census blocks, tracts, places, counties and MSAs
from the Census;
• 1990 and 2000 net population and housing densities by census block
and tract;
• Data for 20+ attribute fields for 1990 and 2000 census tracts;
• Job center locations and employment estimates for 1994 and 2003
based on County Business Patterns zipcode data;
• The nation’s highway and rail infrastructure from the US DOT’s
Bureau of Transportation Statistics;
• Detailed landcover data for 1992 and 2001 from the US Geological
Survey (USGS);
• Federal lands by ownership type from the USGS;
• Major rivers, streams, and waterbodies from the USGS;
• Elevation and slope from the National Elevation Database (NED);
• Riverine, palustrine, and lacaustrine wetlands from the National
Wetland Inventory;
• FEMA Q3 floodzone data; … and much more
All shapefile and raster layers are projected to a common projection (Lambert’s Conformal Conic, North American Datum 1983); and all raster layers utilize a common 500-meter grid cell size making overlays, Boolean algebra, and spatial analysis a snap. Each shapefile and raster dataset is located in its own directory, which is then zipped to reduce space. Zipped datasets vary in size from 500 Kb to over 50Mb. Before downloading, users can preview each dataset in a .pdf map, or review the data specifications in an .html metadata file.
The data were produced at the Institute of Urban and Regional Development (IURD) at the University of California, Berkeley; and the Penn Institute of Urban Research (Penn IUR) at the University of Pennsylvania, in cooperation with Penn's Cartographic Modeling Lab (CML). This work is funded by the National Science Foundation under its Human and Social Dynamics Program. Project working papers and links to other projects and datasets will be forthcoming.
The data is free, and we invite all interested urban and environmental planners, analysts, modelers and enthusiasts to use it with attribution. To our knowledge, this is the first time spatially comprehensive and comparable urban and environmental GIS data is available on a single site. It is our hope that the availability of this and similar data will further narrow traditional disciplinary gaps between urban and environmental planning researchers/practitioners.
Users who uncover problems (Yes, we know "Modeler" is mis-spelled
on the title banner) or might wish to add their own national data to the
website should e-mail John Landis at jlan@design.upenn.edu. Feel free
to forward this announcement to other potential users.
The website address is www.dcrp.ced.berkeley.edu/research/footprint
John Landis
Crossways Professor of City and Regional Planning
PennPlanning
University of Pennsylvania
Penn e-mail: jlan@design.upenn.edu
Berkeley e-mail: jlandis@berkeley.edu
Geodesy and Revised Geoidal Height: How High is Mount
Everest Exactly?
"Measuring our planet's peaks using a standardised reference will
help us better understand the Earth. GOCE will result in an improved accuracy
of the geoid and will facilitate the establishment of a unified global
height system so that heights of the highest mountains in the world can
be directly compared", said Bente Lilja Bye, Research Director from
the Norwegian Mapping and Cadastre Authority. "Another benefit will
be an improvement in our capabilities to predict the behaviour of the
Earth, and hence provide information needed to help mitigate disasters
and economically damaging events."
by Staff Writers
Paris (European Space Agency) Aug 02, 2007
How high is Mount Everest exactly? Recent surveys have come up with heights
that differ by more than five metres. An expedition called the Geodetic
Journey is making its way through China and Tibet to highlight the importance
of geodesy and how an accurate model of the geoid from ESA's GOCE mission
will lead to a unified system for measuring heights. Geodesy is concerned
with measuring and mapping the shape of the Earth's surface, to the benefit
of all branches of Earth sciences and has many practical applications.
Although surveying techniques go back thousands of years, it traditionally
involves taking very precise three-dimensional positioning of points.
It is the means by which the surface of the Earth is mapped and is also
essential in the field of engineering and construction.
Accurate surveying relies on knowledge of the Earth's gravity field, which
defines the horizontal. However, as a result of a number of factors, such
as the fact that mountains and ocean trenches make the surface of the
planet uneven and materials within the Earth's interior are not uniformly
distributed, the force of gravity actually varies slightly from place
to place on the surface of the Earth. Due for launch in early 2008, ESA's
gravity mission GOCE (Gravity field and steady-state Ocean Circulation
Explorer) will provide an extremely accurate and unique picture of the
Earth's gravity field and geoid. The geoid - which is defined by the Earth's
gravity field - is a surface of equal gravitational potential and serves
as a reference point from which to map all topographical features on the
planet. GOCE will provide a model of the geoid with unprecedented accuracy
and will not only be of importance in the field of geodesy, but will also
lead to new insights into ocean circulation, climate change, sea-level
rise, earthquakes and volcanism. Starting in Beijing, and travelling through
central China to Lhasa then on to the Tibetan Plateau and ending in Shanghai,
the Geodetic Journey, which is supported by ESA, will document methods
of ancient surveying through to modern Earth observation. The team, made
up of experts from the Norwegian Mapping and Cadastre Authority and the
Chinese State Bureau of Surveying and Mapping, will promote science and
technology focusing on past and present achievements within surveying
and mapping, geodesy and applications to climate-change research, geo-hazards
and the water cycle. Over the last 10 years an improved knowledge of the
geoid has revolutionised height determination on land by GPS satellites.
However, there remain discrepancies - as in the example of Mount Everest
where the official height in 1999 was stated as 8850 m, but the Chinese
official survey in 2005 stated it as being 8844.43 m.
Although this discrepancy may not seem huge when referring to the highest
point on Earth, a global unified height system would iron out the main
errors so that mountain ranges on one continent could be accurately measured
against those on the other side of the world. Given the harsh and remote
environments of many of the Earth's large mountain ranges such as the
Himalayas or the Andes, an accurate map of the gravity field acquired
from space will contribute significantly to geodesy and surveying. "Measuring
our planet's peaks using a standardised reference will help us better
understand the Earth. GOCE will result in an improved accuracy of the
geoid and will facilitate the establishment of a unified global height
system so that heights of the highest mountains in the world can be directly
compared", said Bente Lilja Bye, Research Director from the Norwegian
Mapping and Cadastre Authority. "Another benefit will be an improvement
in our capabilities to predict the behaviour of the Earth, and hence provide
information needed to help mitigate disasters and economically damaging
events."
Martin Waldseemüller's 1507 map
compiled by Nora Parker, Senior Managing Editor, Directions Magazine
"The historic map was in the news this week because German Chancellor Angela Merkel officially transferred the map to the Library of Congress in a ceremony that took place on Monday, April 30. The map is important for many reasons, not the least of which is that it is the first known map to depict a separate Western hemisphere, and to identify 'America.' The Library of Congress published an article about the map and its acquisition that is good background reading. (The map has actually been housed at the Library of Congress since 2001, and the purchase - from Prince Johannes Waldburg-Wolfegg for $10 million - was completed in 2003.)"
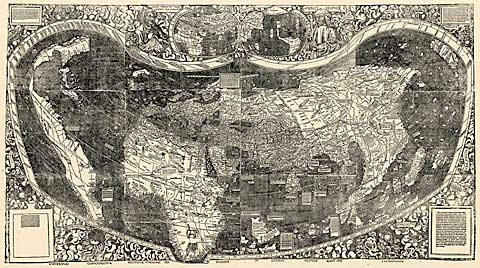
(From Directions Magazine, May 3. Copyright 2007 Directions Media)
Nikolas Schiller's Aerial Imagery Art
compiled by Nora Parker, Senior Managing Editor, Directions Magazine
"Nikolas Schiller contacted me about an in-depth article that appeared about him and his work in the Washington Post last month. Schiller's art/cartography is difficult to describe - it's one of those "you have to look at it to get the idea" kinds of things. A few words that come to mind: hypnotic, rebellious, weird, surreal, beautiful. Below is a quilt pattern generated using an image of the University of California at Los Angeles (UCLA). As a quilter, this one appealed to me, but it's only one example of the art he's cranking out at a rate of at least one map every other day at The Daily Render."
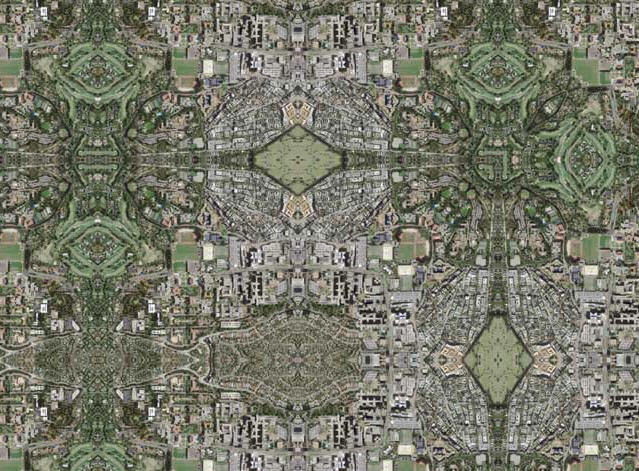
UCLA Quilt #3. Used with permission. View the original and others here.
(Excerpted from the April 5 issue of Directions Magazine. Copyright 2007 Directions Media.)
Check out latest news and imagery at NASA's Earth Observatory Web Site!
http://earthobservatory.nasa.gov/
LANDSAT Data Continuity Mission
"For more than 30 years, Landsat satellites
have collected data of the Earth...
The Landsat Data Continuity Mission (LDCM) is the future of Landsat satellites.
It will continue to obtain valuable data and imagery to be used in agriculture,
education, business, science, and government.
The Landsat Program provides repetitive acquisition
of high resolution multispectral data of the Earth's surface on a global
basis. The data from the Landsat spacecraft constitute the longest record
of the Earth's continental surfaces as seen from space. It is a record
unmatched in quality, detail, coverage, and value."
(introduction from the website)
NASA Goddard has established a website for the LDCM Mission, located at:
http://ldcm.gsfc.nasa.gov
Located there are a number of materials providing status of the planning
for the LDCM. While there is not a lot of detailed schedule information
present, there is an RFI posted for the Mission Operations Element, as
well as documents relating to the spacecraft.
How to solve problems downloading data from the USGS
seamless data server
Have you ever received a data extract error message when you are downloading elevation, land cover, digital raster graphics, or other data from the USGS seamless data server (http://seamless.usgs.gov)? There is a wealth of data on the site, and I receive questions every so often from folks who are frustrated when they get so close to downloading but the last step doesn’t work. Read on.
First, make sure your popup blockers are off, because the seamless server uses popup windows. Or, do the following: Most software will allow you to hold the Ctrl key while selecting your area to disable the pop up blocker for that instance.
Second, the extract error you are receiving may be due to a conflict
with Internet Explorer and Windows XP service pack 2.
Add the extract site as a trusted site, as follows:
1) In Internet Explorer, go to Tools---> Internet Options --->
Security Tab
2) Click on Trusted Sites (third icon in the window)
3) Then click the SITES button. A new window should appear where you can
add a website.
4) At the bottom of the page, Uncheck the box beside --Require server
....
5) In the first box type in http://extract.cr.usgs.gov
6) Click Add --- The website should appear in the second box labeled Websites
Also, if you are using Windows XP service pack 2, click on the custom
level button just above the OK button on the security tab. Scroll down
to the downloads section and make sure all three options are enabled.
Joseph J. Kerski, Ph.D
Education Industry Curriculum Development Manager
Environmental Systems Research Institute, Inc. ESRI
1 International Court
Broomfield CO 80021-3200 USA
jkerski@esri.com
303-449-7779 x 8237 Voice
GPS to GIS Resources
The NPS Intermountain Region developed a GPS to GIS web site a few years
ago that is quite informative on this topic.
You can view it at http://www.nps.gov/gis/gps/gps4gis/
Theresa Ely, National Park Service
~~~~~~~~~~~~~~~~~~~~~
You might receive some questions in your work concerning the bringing in your GPS points into your GIS or mapping software. Whether you use a full GIS package for this or with "mapping software", the plethora of tools available these days to do this in 2D and 3D modes is truly amazing. These include OziExplorer, National Geographic Topo!, ArcGIS, ArcExplorer, MapTech Terrain Navigator, DeLorme TopoQuads and TopoUSA, EasyGPS, USA PhotoMaps, TopoFusion, and more. Some are free; and some you pay for, but the cost may be worth it. Some are even web based these days - for example, see www.gpsvisualizer.com where you can map your GPS coordinates on a web-based map!
I recently borrowed and read the book "GPS Mapping: Make Your
Own Maps."
This very helpful book enabled me sort out in my mind the advantages and
limitations of many of these tools.
GPS Mapping: Make Your Own Maps
Rich Owings, 374 pages, $24.95
Published by Ten Mile Press
633 North Harrison Street
Fort Bragg, CA 95437
1-707-972-8082
ISBN 0-9760926-3-8
The author has a companion web site with examples of output from these
various tools, and much more, on: http://www.makeyourownmaps.com
Joseph J. Kerski, Ph.D.
ASPRS GUIDE to LAND IMAGING SATELLITES
The latest version of the ASPRS GUIDE to LAND IMAGING SATELLITES, developed by Bill Stoney, is now available at http://www.asprs.org/news/satellites/
This version provides the most recent information on land imaging satellites and replaces a version which was distributed at the most recent Pecora 16 Conference in Sioux Falls. It contains a correction to the Satellite Launch data list, which was in error in the printed copy distributed at Pecora.
If you have questions and/or comments, please contact Bill Stoney directly at Wstoney@mitretek.org.
In its overview of Earth Observation Satellites, the Environmental Remote Sensing Center at the University of Wisconsin maintains separate files for past, current, and future Earth observation satellites. The tables include satellite names with hot links; the year of launch; and sensors, number of channels, and spatial resolution. Update frequency is listed on the web site.
(from http://caryandassociates.com with permission.)
GIS Training and Reference Sheets for ArcGIS 9
Three common questions many new (or even long time) GIS users often have are:
- How can I take a map image (scanned or from the web or elsewhere) that
is not geo-referenced and make it line up correctly with other maps in
my GIS?
- I have GIS layer that I need to make changes to on the map. How do I
do this?
- I want create my own layer of features by drawing them into the map.
How does this work?
If you are interested in quick guides that will get you up and running
on these tasks for ArcGIS 9, access them at www.gistrainingsource.com/resources.html
Also available: "Free GIS Layers on the Web:" Worksheet from
May 2006 course
“Additional Resources”, with information on:
- Subscribing to ArcUser Magazine
- Recommended Online Courses
- Demo Software
- GIS PodCasts from ESRI
More information at www.gistrainingsource.com
Kelly Sparks
ESRI Authorized Training Partner
GIS Training Source, Inc.
Colorado Springs, CO
719.659.6059
Kelly@gistrainingsource.com
www.gistrainingsource.com
"GIS Training that fits YOUR needs"
We welcome your contributions to
this page.
Send information to the webmaster.
Please include copyright info. or credit where appropriate.
Last updated Jan. 28, 2009
|
[
Home ] [ Announcements
] [ Newsletter ]
[ GIS
in the Rockies ] [ Officers
] |